Alex Hoehn: SBT GRVL 5th. A Closer Look at the Power of Fatigue Resistance
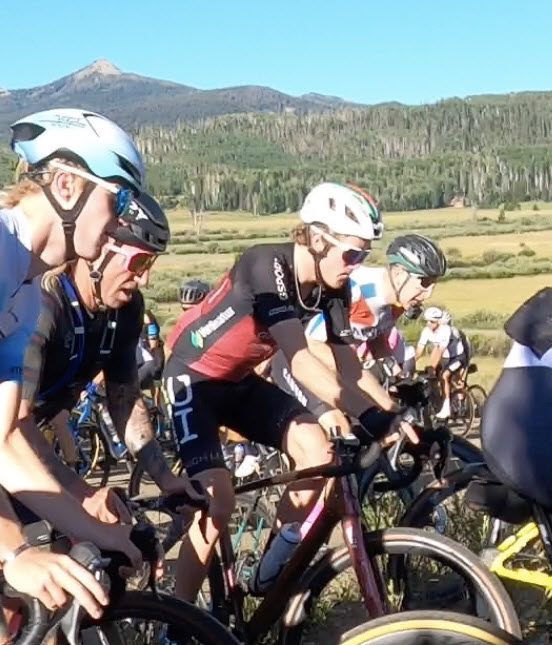
The legendary races of cycling all tell a similar story of overcoming adversity through beautiful suffering. At its core, this very romanticization is excellent at engaging fans while inspiring all of us to persevere through hard work. This suffering is universal across all competitors and it seems like the only difference is if one suffers in solitude or in front of the camera as they ride for glory and fame. It was in front of cameras that Alex Hoehn put in an exceptional ride to finish 5th place at SBT GRVL. The base for that result began years ago when Alex started working on the most important aspect of being an elite athlete.
Fatigue- A better measure of ability
Social media is a great place for overly simple infographics but I’ve never really liked the way most of them are executed for cycling, in particular, ones that state “rider X did 5 minutes at Y watts.” The reason is that elite performances are far more nuanced than simple power output. An analogous statistic is shooting percentage in an NBA game. Yes, it’s an indicator of ability but one stat can only show a tiny piece of a comprehensive view. Sure, Steph Curry went one game without making a 3 pointer but the idea of an armchair athlete believing they could perform as well or better based on that one stat is outrageous. However, too many weekend warrior riders believe themselves similar in ability to Nielsen Powless based on a simple “best 10 minute effort” social media statistic post from Liege- Bastogne- Liege where he was 8th. Trust me when I say that no one reading this who’s never raced professionally in Europe could make it to the first feed zone still attached to the peloton, regardless of what your head unit has ever told you.
Human athletic performance analytics and research have moved beyond one time best efforts and begun to focus on fatigue. How fast does an athlete’s performance degrade? How much does it degrade? What sort of energy expenditure elicits fast/ slow fatigue? How long does the athlete carry the fatigue? How do nutrition and hydration influence fatigue rate (spoiler: proper nutrition and hydration are the easiest ways for most of us to delay fatigue)? What we’re finding is that fatigue resistance is highly trainable and that the best athletes (world-class athletes) tend to fatigue much slower than those of us who are less talented.
We’ve worked to develop Alex Hoehn’s fatigue resistance and being able to see it in action at a top tier gravel event is incredible. Let’s take a closer look at his power file….
SBT GRVL
I always like to talk about an epic one day race in simple terms - we’ll call it the Beginning, Mid-Race, and Endgame. That would look something like this for SBT GRVL….
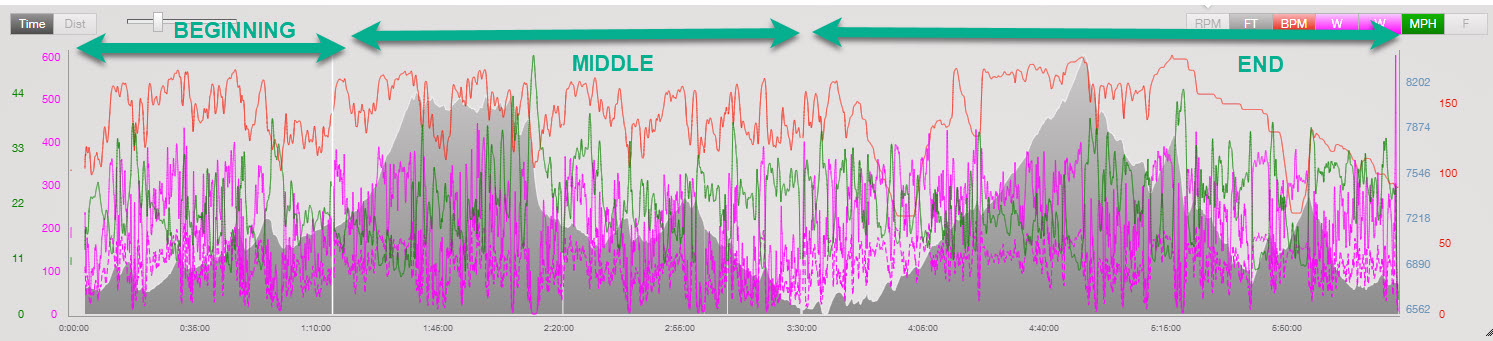
Beginning
As usual, the Beginning is marked by the initial attacks to form some sort of “early move.” This move is always way too early and it never works… until it works. So it has to be respected but generally the riders in the move are destined never to reach the podium… until they do. You get the idea. Alex’s goal in the Beginning of this one-day epic is to simply stay in the front away from danger and out of the wind.
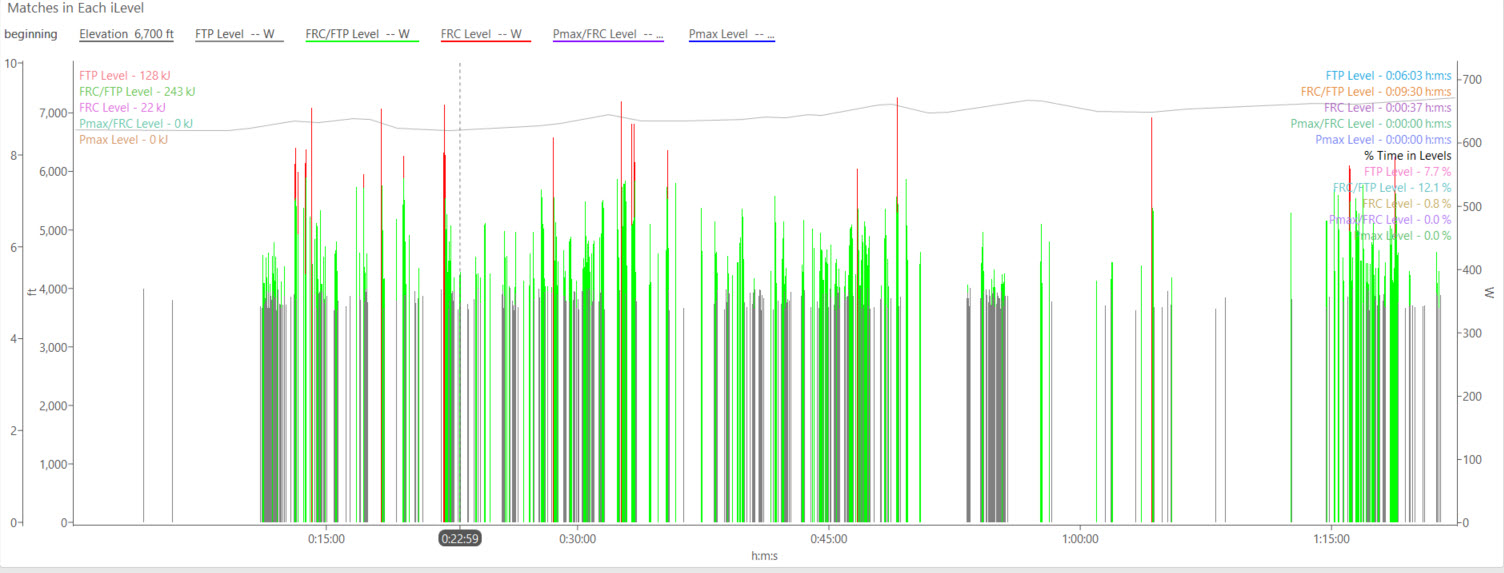
However, accomplishing both of those goals requires energy as Alex must negotiate these minutes very carefully using high throttle efforts when necessary. He must also do this while actively being conservative to avoid degrading his ability to race once we reach the Endgame. During the ~80 minutes of the Beginning, Alex spent about 16 minutes at or above FTP and burned a number of FRC/ FTP and FRC matches (WKO 5 chart below). This was the most dense concentration of high power matches spent on the day. In the end, Alex escaped the opening chapter of the race spending less than 1000kJ at 254w Normalized Power (NP). With a field of this high quality, I’d consider a cost of 3.94 wNP/kg a positive outcome.
Mid-Race
What viewers never see and what is always excluded from interviews and articles is the importance of the Mid-Race execution. What usually defines this chapter of the race is the need for an athlete to stay fueled and hydrated as they wait for the Endgame to start. I’m starting the Mid-Race chapter after the initial surges end and the race proceeds to a major climb that was challenging but remained manageable for Alex from a relative intensity standpoint.
This iLevel Heat Map chart is one of my favorite views as a coach because, along with a good post-race debrief, it allows for a comprehensive understanding of the race at any given time. One thing of note is the series of very hard efforts once the race summited the climb. Those efforts were likely a little too early in the day to be defining moments SBT GRVL. Had the preceding climb been about 5-7% harder, the outcome of those vicious efforts could have been decidedly different.
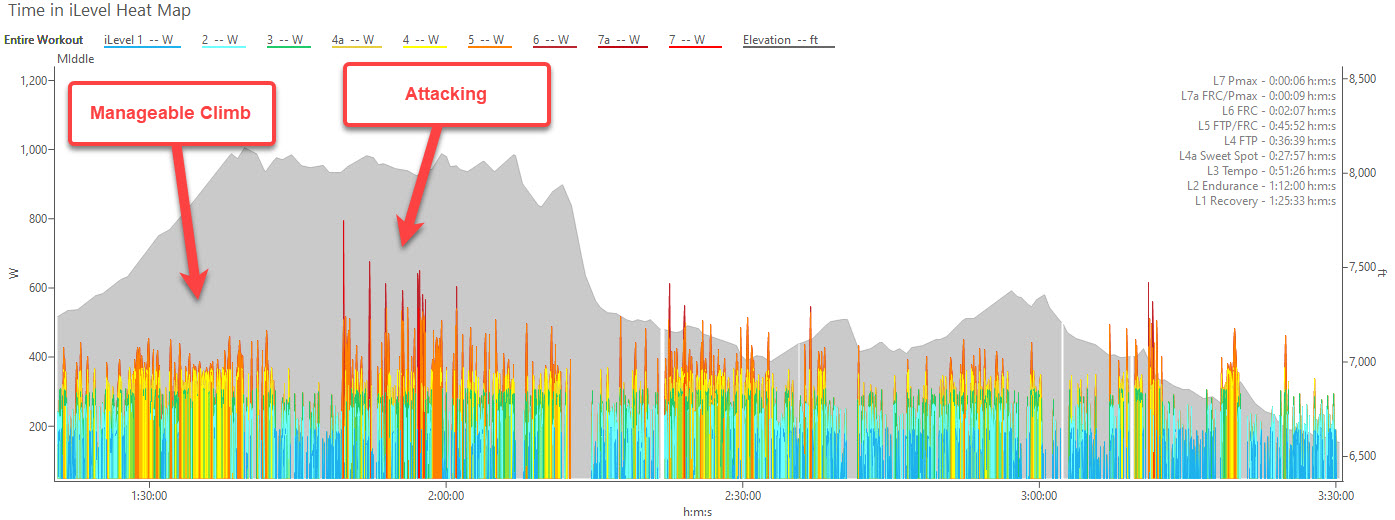
Alex made it through the 129 minutes of Mid-Race only spending 22 minutes at or above FTP. The end result was that this chapter of the race was about 7% easier than the opening chapter and would prove the easiest of the day.
By the conclusion of the Mid-Race, we will see a decisive shift in the day’s protagonists. Remembering the fatigue references before, I draw a line at 2500kJ for athletes similar to Alex’s mass (weight). At that point in the day, rarely do we see an amateur able to perform at an absolute high level. Coincidentally or not, the Endgame at SBT GRVL seems to begin right when Alex turned over 2500 kJ for the day.
Endgame
We can’t always predict when the Endgame is afoot, although the benefit of a power file is hindsight. I’m choosing the beginning of the SBT GRVL Endgame to be where Alex begins to log his best efforts for 20, 30, 60, 90, 120 and 180 minute efforts (obviously there’s overlap). ** The Endgame begins right as Alex turns over 2500kJ for the day after 55% of the race has been completed. The final 45% of the race would see Alex burn another 2491kJ, a superb example of world-class ability and impossible without textbook fueling and hydration throughout the day.
One note: There’s also the cloud of #gravelbeef hanging over the event that likely influenced Alex’s race. Seems like pit strategy is now in play bringing cycling in line with Cyclocross, Nascar, Indy, F1, etc. #gravelbeef seems to be resolved amicably although I’d still buy a t-shirt to go along with my #critbeef shirt. Just sayin!
**Compare this to an amateur criterium where all too frequently the first 5 minutes of the race are the highest 5 minute output, first 10 minutes as the best 10 minutes, first 20 minutes= best 20 minutes and so on until the race concludes.
Looking deeper at the Endgame performance I think Alex’s Strava file tells the tale. Every single one of his 8 KOMs and 6 Cups came once the Endgame began. Given the level of talent on those roads at SBT GRVL, those crowns are an indicator of not only a superb performance but also deep fitness.
Alex was also able to leverage his relative freshness during the Endgame by burning an entire book of FTP and FRC/ FTP matches in the last ~2.5 hours. Considering the altitude and the plentiful extended climbing sectors, creating separation was primarily done with these efforts instead of the sharp accelerations common in the start- stop nature of the earlier chapters. Alex managed to log 44 minutes at or above FTP during the Endgame alone. This amounted to around 34% of the last 2:28 of the race, an incredible ratio.

Finally, Alex was able to close out the day with his best peak powers of the day. He throttled himself at 286wNP at 4.5wNP/ kg for the last 2.5 hours and even turned in a sprint over 1000W which was good enough for 5th on the day.
Final Thoughts
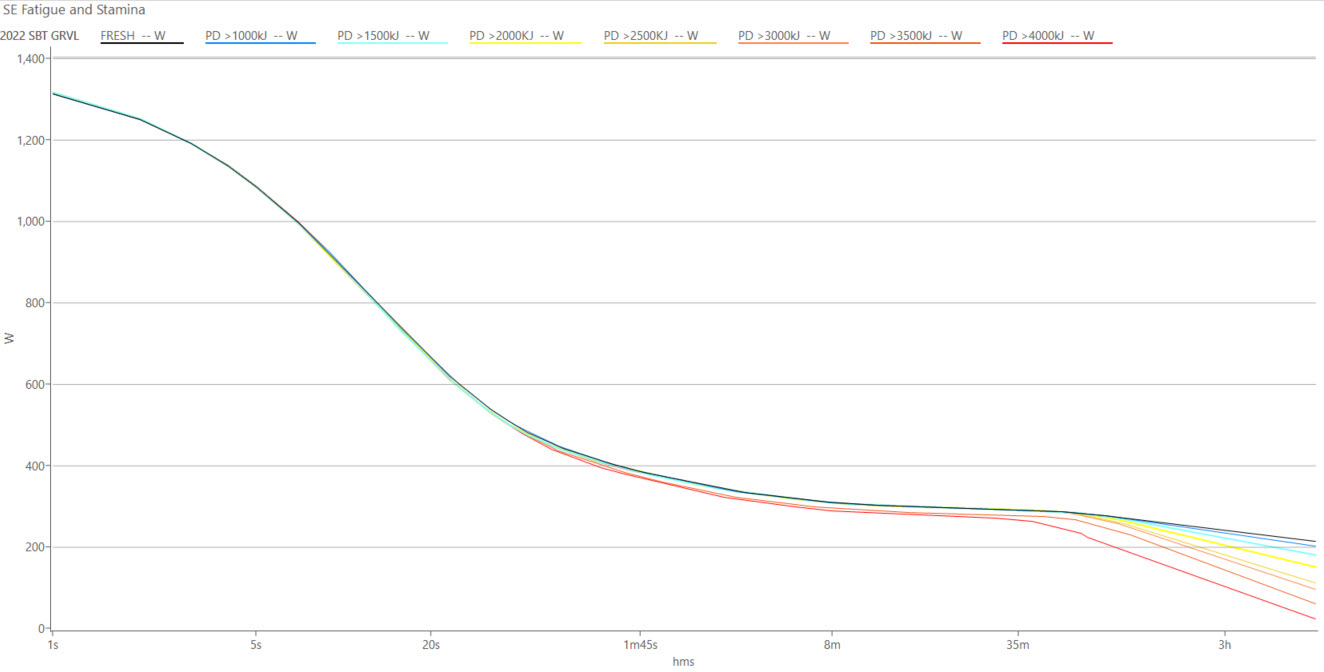
As I mentioned before and alluded to in some social media postings, the difference between amateur and world class athletes is not best measured only with a one-time maximal effort but also in an athlete's ability to resist fatigue. Developing this fatigue resistance is a process that requires trust and patience which are qualities many athletes lack. The ones that embrace the process tend to excel in sport and become regional heroes and/ or household names. But what does a world-class PD Fatigue Curve look like at SBT GRVL? Using the power of WKO5 we’ll take a look here:
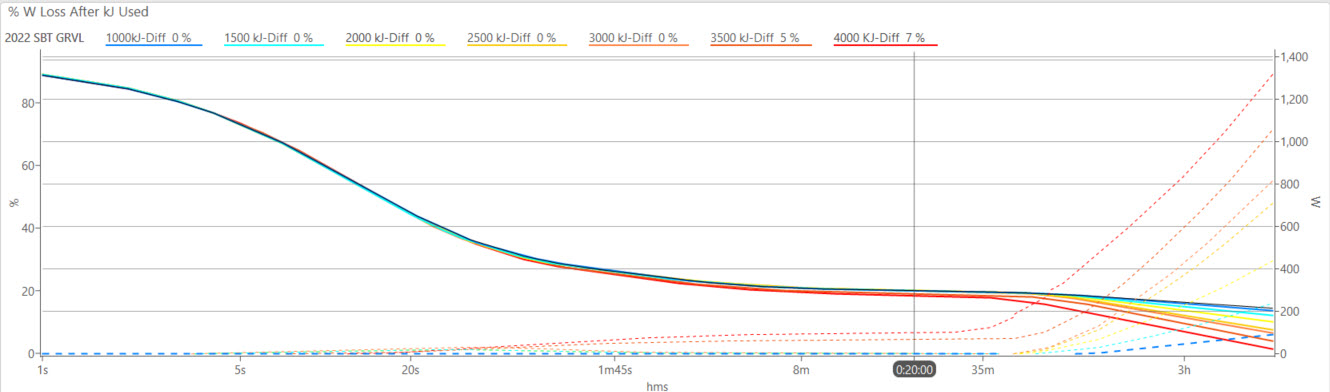
In an effort to make everyone even more jealous I’ll add his percent drop-off for a 20 minute effort. Below you’ll see that, even after burning 4000kJ, Alex had only faded 7% on the day. That’s an effort expected from a World Tour caliber athlete. Perhaps there’s an argument to be made for making that transition….. Stay tuned.
Thanks for reading.
About the Author:
 Adam Mills has raced at the elite level since 2002 and graduated with a Masters Degree in Exercise Physiology from the University of Kansas in 2005. His true talent comes with his ability to combine his vast experience with his knowledge of sport. He is indeed a student of science, sport, athletic performance, strategy, and tactics. He continuously educates himself by keeping up to date with current research trends and methods in sport and his clients have reaped the benefits from this work with over 24 national championships in 11 disciplines on two continents. Adam is able to incorporate these attributes on a daily basis to help his clients reach and exceed their goals whether they are a beginner or a seasoned professional. Learn more about Adam and Source Endurance here.